World Trade Organization: Modest trade growth anticipated for 2014 and 2015 following two year slump
日期:2014-04-15 22:55:48
 World trade is expected to grow by a modest 4.7% in 2014 and at a slightly faster rate of 5.3% in 2015 WTO economists said today (14 April 2014). Although the 2014 forecast of 4.7% is more than double the 2.1% increase of last year, it remainsbelow the 20-year average of 5.3%. For the past two years, growth has averaged only 2.2%.The sluggish pace of trade growth in 2013 was due to a combination of flat import demand in developed economies ( 0.2%) and moderate import growth in developing economies1 (4.4%). On the export side, both developed and developing economies only managed to record small, positive increases (1.5% for developed economies, 3.3% for developing economies).
“For the last two years trade growth has been sluggish. Looking ahead, if GDP forecasts hold true, we expect a broad-based but modest upturn in 2014, and further consolidation of this growth in 2015”, WTO Director-General Roberto Azevêdo said. “It's clear that trade is going to improve as the world economy improves. But I know that just waiting for an automatic increase in trade will not be enough for WTO Members.”
“We can actively support trade growth by updating the rules and reaching new trade agreements. The deal in Bali last December illustrates this.”
“Concluding the Doha round would provide a strong foundation for trade in the future, and a powerful stimulus in today’s slow growth environment. We are currently discussing new ideas and new approaches which would help us to get the job done — and to do it quickly.”
Chart1: Growth in the volume of world merchandise trade and GDP, 2005-15a
Annual % change
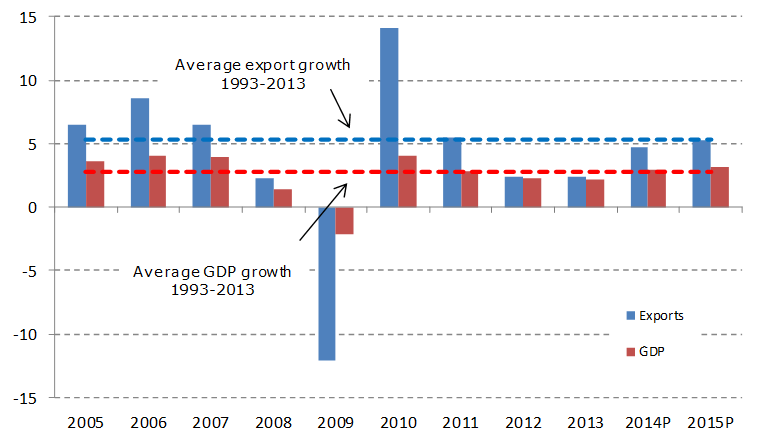
a Figures for 2013 and 2014 are projections.
Source: WTO Secretariat.
Several factors contributed to the weakness of trade and output in 2013, including the lingering impact of the EU recession, high unemployment in euro area economies (Germany being a notable exception), and uncertainty about the timing of the Federal Reserve’s winding down of its monetary stimulus in the United States. The latter contributed to financial volatility in developing economies in the second half of 2013, particularly in certain “emerging” economies with large current account imbalances.
The preliminary estimate of 2.1% for world trade growth in 2013 refers to the average of merchandise exports and imports in volume terms, i.e. adjusted to account for differences in inflation and exchange rates across countries. This figure is slightly lower than the WTO’s most recent forecast of 2.5% for 2013, issued last September. The main reason for the divergence was a stronger than expected decline in developing economies’ trade flows in the second half of last year. For the second consecutive year, world trade has grown at roughly the same rate as world GDP (gross domestic product, a measure of countries’ economic output) at market exchange rates, rather than twice as fast, as is normally the case (Chart 1).
Recent business surveys and industrial production data point to a firming up of the recovery in the United States and Europe in early 2014. The gradual improvement of US employment data has allowed the Federal Reserve to proceed with its planned “tapering”, of their third round of quantitative easing (“QE3”) The outlook for the European Union has also improved, although growth there will remain uneven as long as peripheral EU economies continue to underperform core ones. Output growth in Japan should be slightly lower this year as planned fiscal consolidation is implemented. Finally, despite having hit a soft patch recently, developing economies (including China) should continue to outpace developed economies in terms of GDP and trade growth in the coming year, but some could encounter setbacks, particularly those most exposed to the recalibration of monetary policy in developed countries.
In 2013, the dollar value of world merchandise exports rose 2.1% to $18.8 trillion. This growth rate was slightly less than the WTO’s export volume growth estimate for the year (+2.4%), which implies that export prices declined slightly from one year to the next. Meanwhile, the value of world commercial services exports rose 5.5% to $4.6 trillion.
The trade forecast for 2014 is premised on an assumption of 3.0% growth in world GDP growth at market exchange rates, while the forecast for 2015 assumes output growth of 3.1%. Note that the GDP figures are consensus estimates and are not WTO projections. Risks to the trade forecast are still mostly on the downside, but there is some upside potential, particularly since trade in developed economies is starting from a low base. However, volatility is likely to be a defining feature of 2014 as monetary policy in developed economies becomes less accommodative.
Some developed economy risks factors have receded considerably since last year’s press release, including the sovereign debt crisis in Europe and fiscal brinksmanship between the executive and legislative branches of government in the United States. Developing economies are now the focus of several gathering risks, including large current account deficits (e.g. India, Turkey), currency crises (Argentina), overinvestment in productive capacity, and rebalancing economies to rely more on domestic consumption and less on external demand.
Geopolitical risks have introduced an additional element of uncertainty to the forecast. Civil conflicts and territorial disputes in the Middle East, Asia and Eastern Europe could provoke higher energy prices and disrupt trade flows if they escalate. However, since the timing and impact of these kinds of risks are inherently unpredictable, they are not considered directly in our forecasts.
Chart 2 — Quarterly merchandise trade flows of selected economies, 2010Q1-2013Q4 Seasonally adjusted volume indices, 2010Q1=100
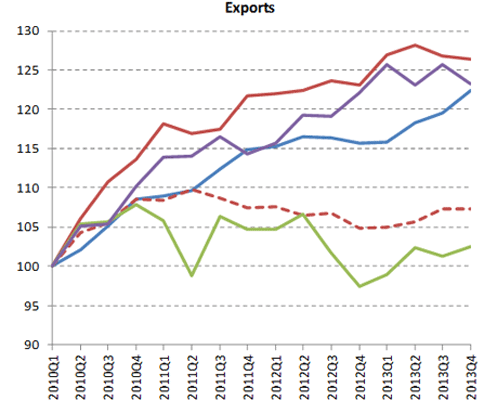
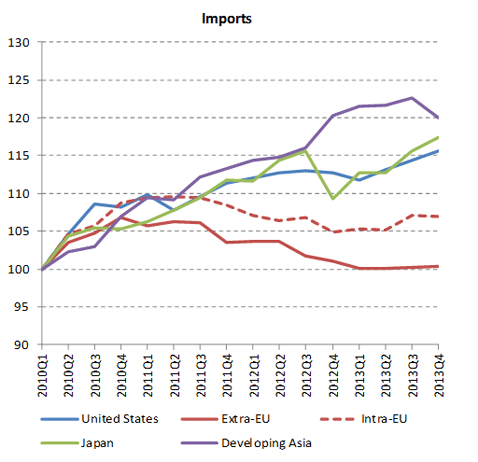
Source: WTO Short-term trade statistics.
More details on trade developments in 2013
The WTO and UNCTAD jointly produce a variety of short-term trade statistics, including seasonally-adjusted quarterly merchandise trade volume indices. These are shown in Chart 2 for the United States, the European Union, Japan and developing Asia (which includes China)2.
After a flat first quarter, US exports grew steadily for the remainder of 2013. In contrast, exports from the Europe Union to the rest of the world (i.e. extra-EU exports) were strongest in the first quarter but weakened and turned negative over the course of the year. Trade between EU countries (i.e. intra-EU exports) rallied slightly in the third quarter but stalled in other periods. Japan saw its exports increase in three out of four quarters in 2013, starting from a low base. Finally, exports from developing Asia treaded water, alternating between positive and negative but trending flat.
Overall, exports in the second half of the year were up for the United States (3.3%), intra EU (2.0%), and Japan (1.2%), while developing Asia was flat (0.0%) and extra EU slightly negative (-1.5%).
On the import side, extra-EU trade trended down throughout the year, sapping global demand. (The story for intra-EU imports is the same as for intra-EU exports, see above.) Meanwhile, US and Japanese imports were generally rising, and developing Asia was mostly flat, only turning negative in the fourth quarter.
In the second half, import demand was improving in some large markets (+2.2% for the US, +1.8% for intra-EU, +0.2% for extra-EU, and +3.3% for Japan), and was slightly negative in developing Asia (0.2%). However, exporters will find little relief until EU imports recover substantially from their current depressed state. (EU merchandise imports represent 32% of world imports including intra-EU trade, and 15% of world imports excluding it.)
Although not shown in Chart 2, quarterly exports and imports of developing economies in total turned negative in the second half of last year, with exports and imports each falling around 2% between the second and fourth quarters. South and Central America’s trade flows were particularly affected (the region’s exports declined by 3% and its imports contracted by 5% during the same period) but other natural resource exporting regions were hit hard as well. However, the declines in developing regions were roughly cancelled by the rising trend for developed economies.
For the second time in two years, merchandise trade has grown more slowly than one would expect given the growth of the world economy as measured by GDP. Although trade can grow faster or more slowly than output in any given year, since the 1990s it has tended to grow about twice as fast as GDP when measured at market exchange rates. In 2012 trade growth fell to the same rate as GDP, and they remained at matching rates in 2013, prompting analysts to question whether the previous relationship continued to hold.
Chart 3 shows 10-year moving averages of world trade growth, world GDP growth and their ratio. This ratio peaked at 2.4 in 2000 but has since fallen to 1.7 in 2013. Historically, trade has tended to contract when world output has slowed, only to rebound sharply afterwards. Structural factors (e.g. the spread of supply chains, the product composition of world trade, subtle protectionism, etc.) may have played a role in the declining ratio. However, given the number and severity of global slowdowns in recent years, the explanation may simply be cyclical. It is too soon to say whether something like a 2:1 relationship between trade growth and GDP growth will reassert itself once the global recovery gains traction, but this variable will bear watching in the future.
Chart 3: 10-year moving average of world trade, GDP and trade/GDP, 1990-2015 Average annual % change (left) and ratio (right)
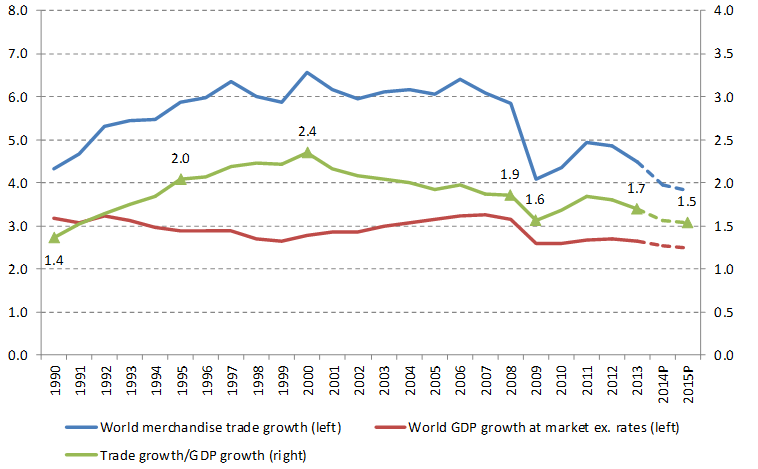
a Figures for 2014 and 2015 are projections.
Source: WTO Secretariat
Additional perspective on the trade forecast
The WTO’s forecast of 4.7% growth in world merchandise trade for 2014 is below the average rate of 5.3% for the last 20 years (1993–2013) and also below the pre-crisis average rate of 6.0% for 1990–2008 (Chart 4). In addition to creating a permanent shift downward in the level of trade, the global recession of 2008-09 may have reduced its average growth rate as well. The average rate of trade expansion in the three years since 2010 is 3.42%. Forecasts for 2014 and 2015, if correct, would raise the average to 4%, but this rate is insufficient to narrow the existing gap.
Chart 4: Volume of world merchandise exports, 1990-2015a
Indices, 1990=100
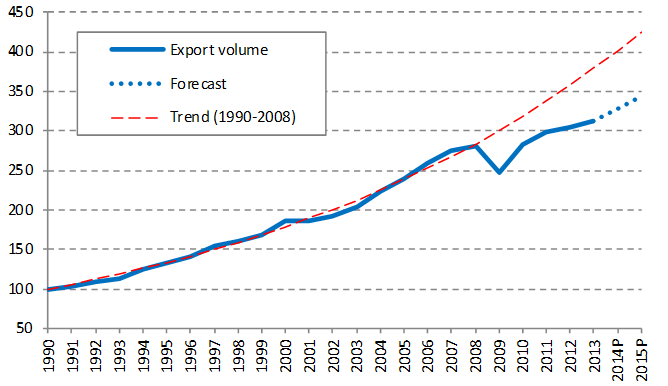
a Figures for 2014 and 2015 are projections.
Source: WTO Secretariat
The divergence between the pre-crisis trend and current levels of world trade continues to widen. This gap stood at 17.0% of the trend level in 2013 and will rise to 19% by 2014 if our projections are realized, which would place world trade further below its the pre-crisis trend than it was in 2009 during what economists have called the “great trade collapse” (Chart 5).
In 2012 the EU recession had a significant dampening effect on measured trade volumes due to the large share of the European Union in world trade (around 1/3 for both exports and imports) and to the fact that, by convention, trade between EU countries is counted in world trade totals. In last year’s press release, we estimated that growth in world trade would have been more than a percentage point higher if the EU was treated as a single entity and intra-EU trade was ignored. A similar calculation for 2013 did not result in a substantially higher growth rate (2.7% for world trade excluding intra-EU trade, compared to 2.1% including it) because although trade within the EU remained depressed it was not declining as sharply as last year. However, if EU economies recover faster than expected and trade between them is revitalized, this could cause world trade to surprise on the upside.
Chart 5: Deviation of world merchandise export volumes from pre-crisis trends, 2005-15a
percent
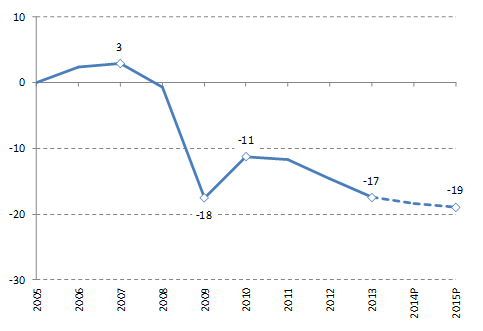
a Figures for 2014 and 2015 are projections.
Source: WTO Secretariat
The state of the world economy and trade in 2013 and 2014Q1
Economic growth
Output trends in developed economies were decidedly mixed during 2013. The 2012 recession in the European Union, which was particularly acute in the euro area, extended into 2013 with a 0.2% contraction in EU GDP the first quarter (annualized rate) according to data from OECD Quarterly National Accounts. Growth remained positive but tepid for the rest of the year, ranging between 1.2% and 1.7% annualized.
In contrast to this performance, the United States saw annualized quarterly growth reach 4.1% in the third quarter, and roughly 2.5% in both Q2 and Q4. After some delay, the US Federal Reserve announced in December of last year that it would begin to wind down its QE3 (third quantitative easing) programme of bond purchases beginning in January. Initial market reaction was muted but after-shocks were felt soon enough, mostly in developing economies.
Japan’s experiment with expanded fiscal and monetary stimulus known as “Abenomics” produced stronger growth in the first two quarters of 2013, but activity slowed in the second half of the year, falling to less than 1% per quarter, annualized.
For developed economies taken together, GDP growth for the whole of 2013 was 1.1%, lower than the 1.3% rate recorded in 2012 and 1.5% expansion of 2011 (Table 1).
Developing economies’ output slowed in 2013 as financial volatility hit some countries harder than others. Developing economies including the Commonwealth of Independent States (CIS) saw their collective GDP growth drop to 4.4% from 4.5% in 2012, down from 5.7% in 2011 (Table 1).
The rise in financial market volatility was most keenly felt in emerging markets with large current account deficits. This is especially true of India, where output growth see-sawed from 2.6% in the second quarter to 7.2% in the third, then back to 3.9% in the fourth (all rates annualized, sourced from the OECD). With financial markets anticipating an early tapering of QE3 in mid-2013, capital flows put pressure on emerging market currencies like India’s Rupee, which suffered a depreciation of 14.5% between April and September (Chart 6). Other emerging market currencies also depreciated significantly against the dollar, including the Argentinean peso, the Turkish lira, the Indonesian rupiah and the South African rand. Idiosyncratic political shocks contributed further to market turbulence in Turkey and Thailand.
In a potentially significant development, China has given its currency greater leeway to fluctuate against other currencies, and monetary authorities allowed the RMB to depreciate by 1.5% against the dollar between January and March. What this portends for the future conduct of Chinese monetary policy remains to be seen, but Chinese authorities have indicated a desire to gradually move their currency toward greater convertibility.
Chart 6: US dollar exchange rates against currencies of selected countries, January 2005 — March 2014
Indices of US dollars per unit of national currency, 1 January 2005 = 100
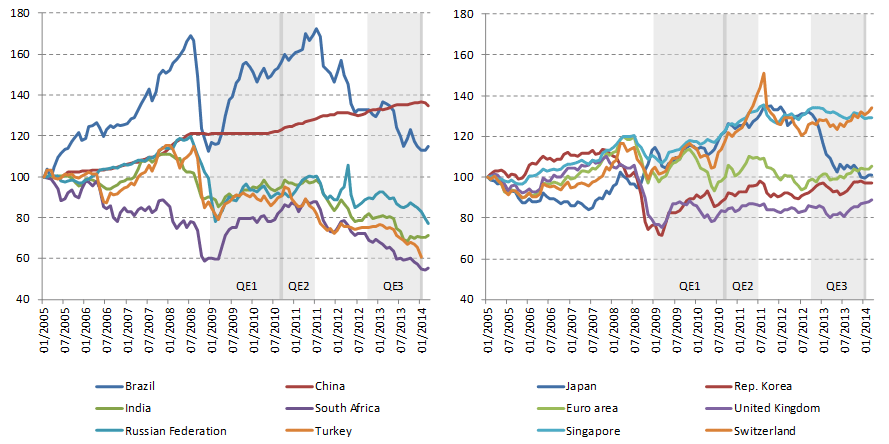
Source: Federal Reserve Bank of St. Louis except for Russian Federationand Turkey, which are sourced from IMF International FinancialStatistics.
Table 1: GDP and merchandise trade by region, 2011-13
Annual % change
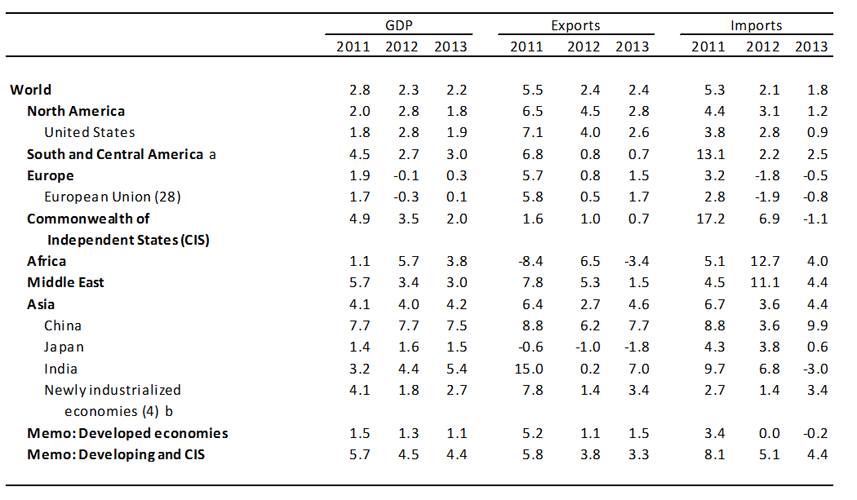
a Includes the Caribbean
b Hong Kong, China; Republic of Korea; Singapore and Chinese Taipei
Source: WTO Secretariat.
Source: World Trade Organization